138 statistics on international and multilingual search, in ten sections: the languages of the web, who is online, how language affects buying, cross-border shopping, search engines by country, and how AI is changing search, clicks and crawling. Every figure links to the page it came from, and each one was checked against that page on 26 October 2026.
Key takeaways
- English is the content language of 49.5% of websites whose language is known, while Chinese accounts for 1.2% and Arabic for 0.6% (W3Techs, October 2026).
- 74% of the world's population used the internet in 2025, but only 36% of people in Africa did (ITU).
- In a CSA Research survey of 8,709 consumers in 29 countries, 76% preferred to buy products with information in their native language and 40% said they never buy from websites in other languages (2020).
- Google's search engine market share was 89.94% worldwide in September 2026, but 47.97% in South Korea, 28.12% in Russia and 1.46% in China (StatCounter).
- Generative AI use in the EU ranged from 48.4% of people aged 16 to 74 in Denmark to 17.8% in Romania in 2025 (Eurostat).
- US Google users clicked a traditional search result on 8% of visits to results pages with an AI summary, against 15% on pages without one (Pew Research Center, March 2025).
- 67% of 374,756 domains using hreflang had at least one hreflang issue, most often a missing x-default (Ahrefs, 2023).
Contents
- The languages of the web (13)
- Who is online, and where growth is (13)
- Language and buying decisions (13)
- Cross-border online shopping (13)
- Search engine share by country (13)
- Generative AI adoption by country (16)
- AI answers in search, by market (14)
- Clicks after AI answers (15)
- AI crawlers, bots and robots.txt (17)
- hreflang and international setup in the wild (11)
- Using these statistics
- Methodology
The languages of the web
About half of all websites are in English, while languages with large online populations such as Chinese, Arabic and Hindi each make up around 1% or less of websites and crawled pages.
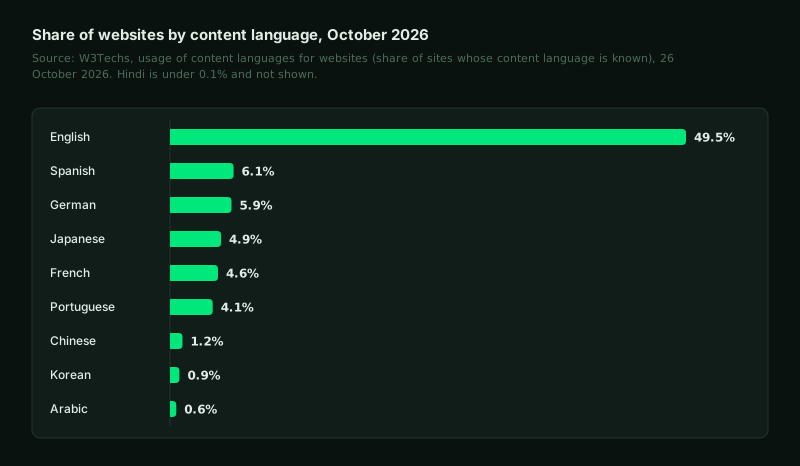
- English is the content language of 49.5% of all websites whose language W3Techs can identify. Source: W3Techs, Usage statistics of content languages for websites.
- Spanish is the second most common website content language, used by 6.1% of websites whose language W3Techs can identify. Source: W3Techs, Usage statistics of content languages for websites.
- German is the content language of 5.9% of websites, and Japanese of 4.9%, according to W3Techs. Source: W3Techs, Usage statistics of content languages for websites.
- French is used on 4.6% of websites and Portuguese on 4.1%, according to W3Techs. Source: W3Techs, Usage statistics of content languages for websites.
- Chinese is the content language of only 1.2% of websites whose language W3Techs can identify. Source: W3Techs, Usage statistics of content languages for websites.
- Arabic is used on 0.6% of websites and Korean on 0.9%, according to W3Techs. Source: W3Techs, Usage statistics of content languages for websites.
- Hindi is among the languages W3Techs finds on less than 0.1% of websites. Source: W3Techs, Usage statistics of content languages for websites.
- In Common Crawl's CC-MAIN-2026-43 crawl, 42.5647% of HTML pages were detected as primarily English. Source: Common Crawl, Statistics of Common Crawl Monthly Archives: Distribution of Languages.
- Russian was the second most detected language in Common Crawl's CC-MAIN-2026-43 crawl, at 6.3018% of HTML pages. Source: Common Crawl, Statistics of Common Crawl Monthly Archives: Distribution of Languages.
- German (5.7673%), Japanese (4.8876%), French (4.7605%) and Spanish (4.7390%) each made up roughly 5% of HTML pages in Common Crawl's CC-MAIN-2026-43 crawl. Source: Common Crawl, Statistics of Common Crawl Monthly Archives: Distribution of Languages.
- Chinese accounted for 4.3706% of HTML pages in Common Crawl's CC-MAIN-2026-43 crawl, Arabic for 0.6675% and Hindi for 0.2111%. Source: Common Crawl, Statistics of Common Crawl Monthly Archives: Distribution of Languages.
- English's share of HTML pages in Common Crawl rose from 40.4526% in the CC-MAIN-2026-34 crawl to 42.5647% in CC-MAIN-2026-43. Source: Common Crawl, Statistics of Common Crawl Monthly Archives: Distribution of Languages.
- 364 Wikipedia language editions have been officially created by the Wikimedia Foundation, of which 348 are active. Source: Wikimedia Meta-Wiki, List of Wikipedias.
Who is online, and where growth is
Three in four people are online, and nearly all of those still offline live in low- and middle-income countries, where internet use is growing fastest.
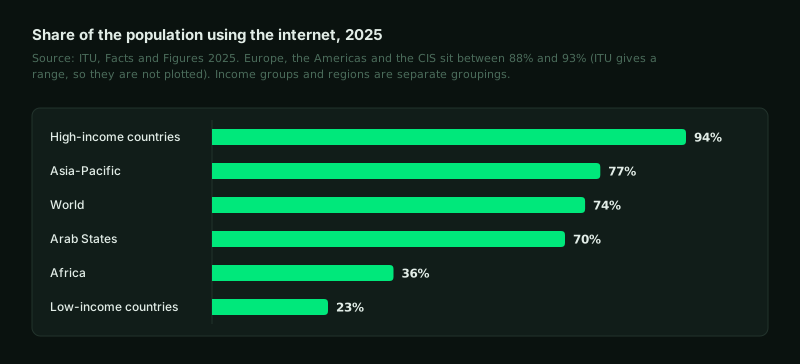
- 74% of the world's population, about 6 billion people, used the internet in 2025, up from 71% a year earlier. Source: ITU, Facts and Figures 2025: Internet use.
- The number of internet users grew 3.3% year on year in 2025, up from 2.9% the year before. Source: ITU, Facts and Figures 2025: Internet use.
- 2.2 billion people were still offline in 2025, down from a revised 2.3 billion in 2024. Source: ITU press release, Facts and Figures 2025.
- Between 88% and 93% of people use the internet in Europe, the Americas and the CIS region, the most connected regions in ITU's 2025 estimates. Source: ITU, Facts and Figures 2025: Internet use.
- Internet use stood at 77% in Asia-Pacific and 70% in the Arab States in 2025. Source: ITU, Facts and Figures 2025: Internet use.
- Only 36% of people in Africa used the internet in 2025, the lowest of any region. Source: ITU, Facts and Figures 2025: Internet use.
- Internet use in the least developed countries grew by an average of 7.4% in 2025, faster than in most other groups, though only 34% of their population is online. Source: ITU, Facts and Figures 2025: Internet use.
- 94% of people in high-income countries use the internet, compared with 23% in low-income countries. Source: ITU press release, Facts and Figures 2025.
- 96% of the people who are still offline live in low- and middle-income countries. Source: ITU press release, Facts and Figures 2025.
- 85% of people in urban areas are online, compared with 58% in rural areas. Source: ITU press release, Facts and Figures 2025.
- 4.7 billion people, 58% of the world's population, used mobile internet on their own device in 2024. Source: GSMA, The State of Mobile Internet Connectivity 2025 (press release).
- About 300 million people, 4% of the world's population, live where there is no mobile internet coverage at all. Source: GSMA, The State of Mobile Internet Connectivity 2025 (press release).
- 3.4 billion people were not connected to mobile internet services in 2024, most of them living in areas that do have coverage. Source: GSMA, The State of Mobile Internet Connectivity 2025 (press release).
Language and buying decisions
Most online shoppers prefer to buy in their own language and a large minority will not buy otherwise, although the most-cited survey on this dates from 2020.
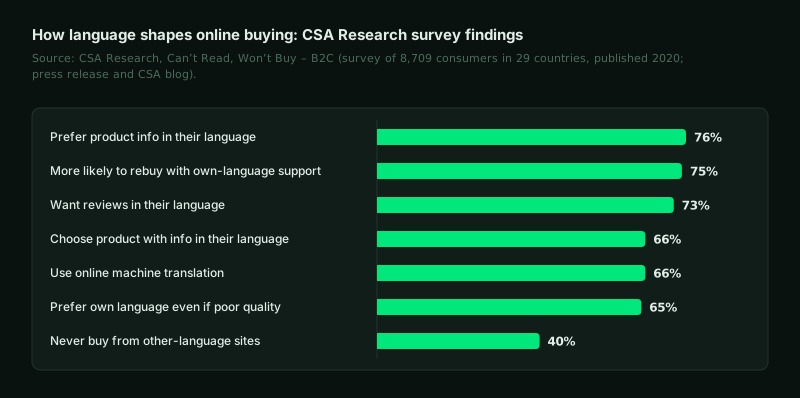
- In a CSA Research survey of 8,709 consumers in 29 countries, 76% of online shoppers said they prefer to buy products with information in their native language. Source: CSA Research, press release on Can't Read, Won't Buy – B2C (2020).
- 40% of the online shoppers surveyed by CSA Research said they will never buy from websites in other languages. Source: CSA Research, press release on Can't Read, Won't Buy – B2C (2020).
- Germany had the largest share of consumers who buy only at local-language websites in CSA Research's 29-country survey, at 57%. Source: CSA Research, press release on Can't Read, Won't Buy – B2C (2020).
- 65% of consumers in CSA Research's survey prefer content in their own language even if it is of poor quality. Source: CSA Research, press release on Can't Read, Won't Buy – B2C (2020).
- 73% of consumers surveyed by CSA Research want product reviews in their language, if nothing else is translated. Source: CSA Research, press release on Can't Read, Won't Buy – B2C (2020).
- 66% of the consumers in CSA Research's survey use online machine translation. Source: CSA Research, press release on Can't Read, Won't Buy – B2C (2020).
- 67% of consumers surveyed by CSA Research tolerate mixed languages on a website. Source: CSA Research, press release on Can't Read, Won't Buy – B2C (2020).
- Given a choice between similar products, 66% of CSA Research's respondents pick the one with information in their language; among those least competent in English the figure is around 85%. Source: CSA Research, Does Language Matter? The Impact of Language on the Customer Journey.
- 75% of CSA Research's respondents say they are more likely to buy from the same brand again if customer care is in their language. Source: CSA Research, Does Language Matter? The Impact of Language on the Customer Journey.
- Respondents confident in reading English were 6.81 times more likely to buy on English-language websites than respondents with no English, according to CSA Research. Source: CSA Research, Does Language Matter? The Impact of Language on the Customer Journey.
- 59% of Europeans can hold a conversation in at least one foreign language, rising to 79% among 15 to 24 year olds. Source: European Commission, Europeans' language skills (2024 survey on Europeans and their languages).
- 47% of Europeans can speak English as a foreign language, making it the most widely spoken foreign language in the EU. Source: European Commission, Europeans strive toward multilingualism (Eurobarometer news).
- The global addressable market for language solutions and language AI was valued at USD 30.85 billion in 2025, and Slator projects USD 36.10 billion by 2031 (CAGR 2.65%). Source: Slator, 2026 Language Solutions & AI Market Report.
Cross-border online shopping
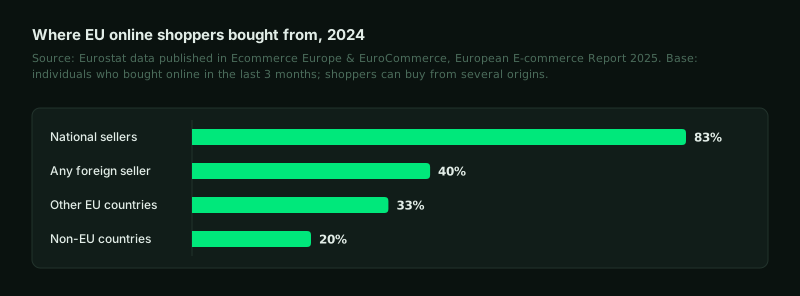
Online shopping is near-universal among EU internet users, and four in ten EU online shoppers already buy from sellers in other countries.
- 78% of EU internet users aged 16 to 74 bought or ordered goods or services online in 2025. Source: Eurostat, E-commerce statistics for individuals.
- The share of EU internet users who shop online rose from 62% in 2015 to 78% in 2025. Source: Eurostat, E-commerce statistics for individuals.
- Ireland (87%) and the Netherlands (86%) had the EU's highest shares of people who bought online in the three months before Eurostat's 2025 survey. Source: Eurostat, E-commerce statistics for individuals.
- In 2024, 83% of EU online shoppers bought from sellers in their own country, according to Eurostat data published in the European E-commerce Report 2025. Source: Ecommerce Europe & EuroCommerce, European E-commerce Report 2025 (light version).
- 33% of EU online shoppers bought from sellers in other EU countries in 2024, according to Eurostat data published in the European E-commerce Report 2025. Source: Ecommerce Europe & EuroCommerce, European E-commerce Report 2025 (light version).
- 20% of EU online shoppers bought from sellers outside the EU in 2024, according to Eurostat data published in the European E-commerce Report 2025. Source: Ecommerce Europe & EuroCommerce, European E-commerce Report 2025 (light version).
- 40% of EU online shoppers bought from a seller in another country, EU or non-EU, in 2024, according to Eurostat data published in the European E-commerce Report 2025. Source: Ecommerce Europe & EuroCommerce, European E-commerce Report 2025 (light version).
- Total B2C e-commerce turnover in Europe grew by 7% in 2024, from 784 billion to 842 billion. Source: Ecommerce Europe & EuroCommerce, European E-commerce Report 2025 (light version).
- Adjusted for inflation, European B2C e-commerce grew by 4.6% in 2024. Source: Ecommerce Europe & EuroCommerce, European E-commerce Report 2025 (light version).
- 61% of online shoppers in IPC's 37-country survey say clear information on delivery charges before purchase is essential when buying from another country. Source: International Post Corporation, Cross-Border E-commerce Shopper Survey 2025.
- Temu's share of shoppers' most recent cross-border orders rose from less than 1% in 2022 to 24% in 2025, putting it level with Amazon. Source: International Post Corporation, Cross-Border E-commerce Shopper Survey 2025.
- The share of cross-border parcels taking 15 or more days to arrive fell from 29% in 2020 to 7% in 2025. Source: International Post Corporation, Cross-Border E-commerce Shopper Survey 2025.
- 44% of IPC's respondents used doorstep delivery for cross-border orders, 13% parcel lockers and 12% delivery direct to the mailbox. Source: International Post Corporation, Cross-Border E-commerce Shopper Survey 2025.
Search engine share by country
Google leads most markets, but local engines lead or compete closely in Russia, China and South Korea, and the share figures depend on how they are measured.
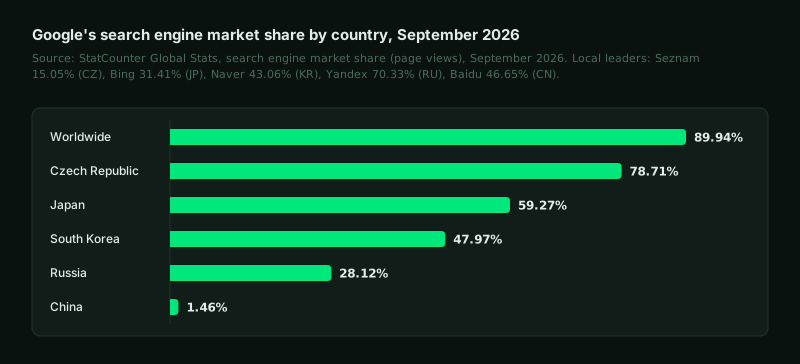
- Google had 89.94% of worldwide search engine market share in September 2026, with Bing second at 5.29%, according to StatCounter's page-view data. Source: StatCounter, Search engine market share worldwide.
- In South Korea, Google held 47.97% of search engine market share in September 2026 and the local engine Naver 43.06%. Source: StatCounter, Search engine market share in South Korea.
- In the Czech Republic, Google held 78.71% of search engine market share in September 2026 and the local engine Seznam 15.05%. Source: StatCounter, Search engine market share in the Czech Republic.
- In Russia, Yandex held 70.33% of search engine market share in September 2026, against 28.12% for Google. Source: StatCounter, Search engine market share in the Russian Federation.
- In China, Baidu held 46.65% of search engine market share in September 2026, followed by Bing at 21.76% and Haosou at 12.26%. Source: StatCounter, Search engine market share in China.
- Google's search engine market share in China was 1.46% in September 2026. Source: StatCounter, Search engine market share in China.
- In Japan, Google held 59.27% of search engine market share in September 2026, Bing 31.41% and Yahoo! 7.61%. Source: StatCounter, Search engine market share in Japan.
- Google referred nearly 90% of search traffic to Cloudflare-protected sites worldwide in 2025; Bing referred 3.1%, Yandex 2.0%, Baidu 1.4% and DuckDuckGo 1.2%. Source: Cloudflare, Radar 2025 Year in Review.
- By Cloudflare's 2025 referral data, Yandex holds a 65% share of search in Russia, almost double Google's 34%. Source: Cloudflare, Radar 2025 Year in Review.
- In the Czech Republic, Google referred 84% of search traffic seen by Cloudflare in 2025 and Seznam 7.7%. Source: Cloudflare, Radar 2025 Year in Review.
- On desktop systems worldwide, Google's share of search referrals drops to about 80% and Bing's rises to nearly 11%, according to Cloudflare. Source: Cloudflare, Radar 2025 Year in Review.
- On Windows systems, Google referred 76% of search traffic seen by Cloudflare in 2025 and Bing about 14%. Source: Cloudflare, Radar 2025 Year in Review.
- On mobile devices, Google held almost 93% of search referrals seen by Cloudflare in 2025, the same on Android and iOS. Source: Cloudflare, Radar 2025 Year in Review.
Generative AI adoption by country
Generative AI use differs by more than two to one between countries and tracks income and digital readiness.
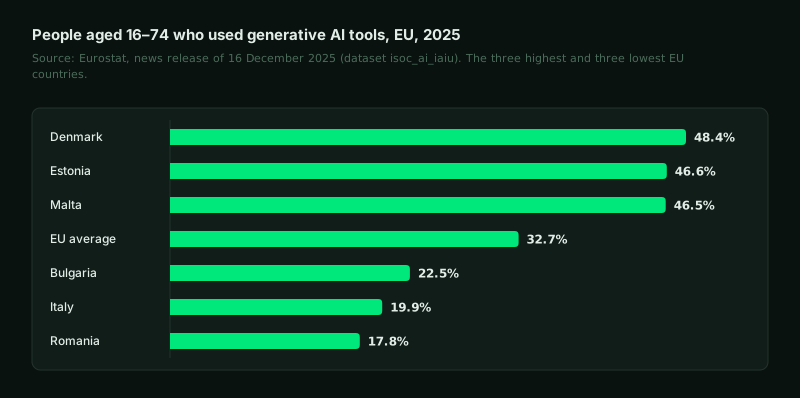
- 32.7% of people aged 16 to 74 in the EU used generative AI tools in 2025. Source: Eurostat, 32.7% of EU people used generative AI tools in 2025.
- Generative AI use in the EU was highest in Denmark (48.4%), Estonia (46.6%) and Malta (46.5%) in 2025. Source: Eurostat, 32.7% of EU people used generative AI tools in 2025.
- Generative AI use in the EU was lowest in Romania (17.8%), Italy (19.9%) and Bulgaria (22.5%) in 2025. Source: Eurostat, 32.7% of EU people used generative AI tools in 2025.
- Weekly use of generative AI nearly doubled from 18% to 34% between 2024 and 2025 across Argentina, Denmark, France, Japan, the UK and the US. Source: Reuters Institute, Generative AI and News Report 2025.
- Weekly use of generative AI for getting information more than doubled from 11% to 24% between 2024 and 2025 across the six countries. Source: Reuters Institute, Generative AI and News Report 2025.
- 16.3% of the world's population used generative AI tools in the second half of 2025, up from 15.1% in the first half. Source: Microsoft AI Economy Institute, Global AI Adoption in 2025 (AI Diffusion Report H2 2025).
- 24.7% of the working-age population in the Global North used AI tools at the end of 2025, compared with 14.1% in the Global South. Source: Microsoft AI Economy Institute, Global AI Adoption in 2025 (AI Diffusion Report H2 2025).
- The United Arab Emirates had the highest AI adoption in the world at the end of 2025, at 64.0% of the working-age population, followed by Singapore at 60.9%. Source: Microsoft AI Economy Institute, Global AI Adoption in 2025 (AI Diffusion Report H2 2025).
- The United States ranked 24th for AI use among the working-age population at the end of 2025, with a 28.3% usage rate. Source: Microsoft AI Economy Institute, Global AI Adoption in 2025 (AI Diffusion Report H2 2025).
- South Korea climbed from 25th to 18th in global AI adoption in the second half of 2025; Microsoft names better frontier models for the Korean language as one of three drivers. Source: Microsoft AI Economy Institute, Global AI Adoption in 2025 (AI Diffusion Report H2 2025).
- On the Korean college entrance exam (CSAT) benchmark, GPT-3.5 scored 16, GPT-4o 75 and GPT-5 100, according to Microsoft's AI Diffusion Report. Source: Microsoft AI Economy Institute, Global AI Adoption in 2025 (AI Diffusion Report H2 2025).
- The United States accounted for 21.6% of global Claude use in Anthropic's September 2025 Economic Index, the largest share of any country. Source: Anthropic Economic Index: the geography of AI use (September 2025).
- Across countries, a 1% higher GDP per capita was associated with a 0.7% higher score on Anthropic's AI Usage Index, which measures Claude use relative to working-age population. Source: Anthropic Economic Index: the geography of AI use (September 2025).
- 83% of people in China, 80% in Indonesia and 77% in Thailand say AI products and services offer more benefits than drawbacks, compared with 39% in the United States and 36% in the Netherlands. Source: Stanford HAI, 2025 AI Index Report: Public Opinion.
- The global share of people who see AI products and services as more beneficial than harmful rose from 52% in 2022 to 55% in 2024. Source: Stanford HAI, 2025 AI Index Report: Public Opinion.
- On average across 30 countries, 52% say products and services using AI make them excited and 53% say AI makes them nervous. Source: Ipsos, The Ipsos AI Monitor 2025.
AI answers in search, by market
AI answers are now a routine part of search in most markets, and exposure depends largely on where Google has launched them.
- Google's AI Overviews were available in more than 200 countries and territories and more than 40 languages as of May 2025. Source: Google, AI Overviews are now available in over 200 countries and territories, and more than 40 languages (May 2025).
- In the US and India, Google says AI Overviews drove an increase of more than 10% in usage of Google for the types of queries that show them. Source: Google, AI Overviews are now available in over 200 countries and territories, and more than 40 languages (May 2025).
- AI Overviews had more than 2 billion monthly users in Q2 2025, according to Alphabet. Source: Alphabet Q2 2025 earnings call: CEO's remarks.
- Google's AI Mode had more than 100 million monthly active users in the US and India in Q2 2025, while still rolling out. Source: Alphabet Q2 2025 earnings call: CEO's remarks.
- In October 2025, Google launched AI Mode in more than 35 new languages and over 40 new countries and territories, bringing it to more than 200 countries and territories. Source: Google, AI Mode is now available in more languages and locations around the world (October 2025).
- Google says questions asked in AI Mode are nearly three times longer than traditional searches. Source: Google, AI Mode is now available in more languages and locations around the world (October 2025).
- AI Mode passed 1 billion monthly active users by Q2 2026, after its global expansion in October 2025. Source: Alphabet Q2 2026 earnings call: CEO's remarks.
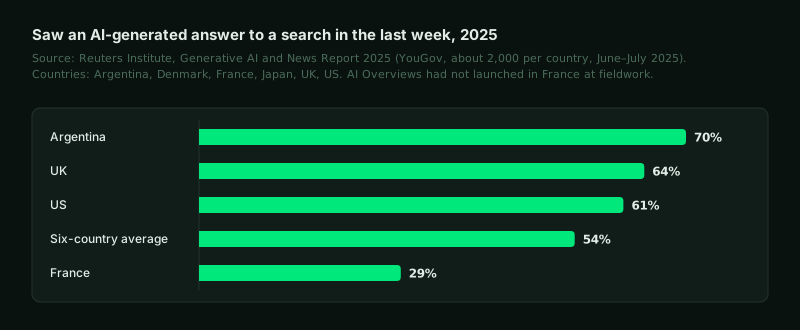
- 54% of people across Argentina, Denmark, France, Japan, the UK and the US said they saw an AI-generated answer to a search in the past week, with another 19% unsure. Source: Reuters Institute, Generative AI and News Report 2025.
- Weekly exposure to AI search answers was highest in Argentina (70%), the UK (64%) and the US (61%), and lowest in France (29%), where AI Overviews had not launched at the time of the survey. Source: Reuters Institute, Generative AI and News Report 2025.
- Weekly use of AI chatbots for news rose from 7% to 10% globally in a year, driven mostly by growth in parts of Asia, Africa, Latin America, and Southern and Eastern Europe. Source: Reuters Institute, Digital News Report 2026: Emerging uses of AI chatbots for news.
- 18% of the Google searches made by 900 tracked US adults in March 2025 produced an AI summary; 58% of the adults saw at least one. Source: Pew Research Center, Google users are less likely to click on links when an AI summary appears in the results (2025).
- Just 8% of one- or two-word Google searches produced an AI summary, compared with 53% of searches of 10 words or more. Source: Pew Research Center, Google users are less likely to click on links when an AI summary appears in the results (2025).
- 82% of desktop and 76% of mobile AI Overviews in Semrush's 200,000-keyword sample appeared for keywords with fewer than 1,000 monthly searches. Source: Semrush, AI Overviews study (200,000 keywords).
- Only 5% of search results pages with an AI Overview also showed PPC ads, in Semrush's 200,000-keyword sample. Source: Semrush, AI Overviews study (200,000 keywords).
Clicks after AI answers
When an AI answer appears, fewer people click through to websites, and in every country measured most Google searches already end without a click.
- US Google users clicked a traditional search result on 8% of visits to results pages with an AI summary, against 15% on pages without one. Source: Pew Research Center, Google users are less likely to click on links when an AI summary appears in the results (2025).
- Users clicked a link inside Google's AI summary on just 1% of visits to pages that showed one. Source: Pew Research Center, Google users are less likely to click on links when an AI summary appears in the results (2025).
- Users ended their browsing session on 26% of Google results pages with an AI summary, compared with 16% of pages without one. Source: Pew Research Center, Google users are less likely to click on links when an AI summary appears in the results (2025).
- Wikipedia, YouTube and Reddit made up 15% of the sources linked in Google's AI summaries and 17% of those in standard results. Source: Pew Research Center, Google users are less likely to click on links when an AI summary appears in the results (2025).
- The presence of an AI Overview correlated with a 58% lower average click-through rate for the top-ranking page in December 2025 data, up from 34.5% in April 2025 (Ahrefs, 300,000 keywords). Source: Ahrefs, Update: AI Overviews Reduce Clicks by 58% (February 2026).
- AI Overviews were associated with a 50.8% lower click-through rate for position 2 and 19.4% lower for position 10, according to Ahrefs. Source: Ahrefs, Update: AI Overviews Reduce Clicks by 58% (February 2026).
- Pages cited in an AI Overview got 35% more organic clicks and 91% more paid clicks than pages that were not cited, in Seer Interactive's Q3 2025 data. Source: Seer Interactive, AIO impact on Google CTR: September 2025 update.
- For queries with an AI Overview where a brand was not cited, organic CTR was 0.52% in Q3 2025, down 65.2% year on year. Source: Seer Interactive, AIO impact on Google CTR: September 2025 update.
- Even on queries with no AI Overview, organic CTR fell 46.2% year on year to 1.45% in Q3 2025, in Seer Interactive's data. Source: Seer Interactive, AIO impact on Google CTR: September 2025 update.
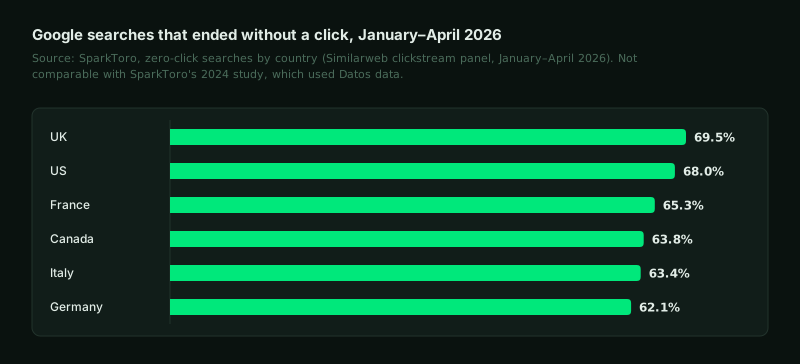
- UK Google searches had the highest zero-click rate (69.5%) among six countries studied in January to April 2026, and Germany the lowest (62.1%). Source: SparkToro, Zero-click searches: highest in the UK, lowest in Germany (2026, Similarweb data).
- Zero-click rates in January to April 2026 were 68.0% in the US, 65.3% in France, 63.8% in Canada and 63.4% in Italy. Source: SparkToro, Zero-click searches: highest in the UK, lowest in Germany (2026, Similarweb data).
- In 2024, 59.7% of Google searches in the EU and 58.5% in the US ended without a click. Source: SparkToro, 2024 Zero-Click Search Study (Datos clickstream data).
- For every 1,000 Google searches in 2024, 374 clicks went to the open web in the EU and 360 in the US. Source: SparkToro, 2024 Zero-Click Search Study (Datos clickstream data).
- Among people who saw AI search answers, 33% say they always or often click through to sources, 37% sometimes and 28% rarely or never. Source: Reuters Institute, Generative AI and News Report 2025.
- In nearly all of the 27 markets asked, the share who always or often click from AI chatbots to the original source is in low single digits: 1% in the UK, 3% in Spain and 4% in Argentina; South Korea is higher at 8%. Source: Reuters Institute, Digital News Report 2026: Emerging uses of AI chatbots for news.
AI crawlers, bots and robots.txt
AI bots request far more pages than they send visitors back, and a small but fast-growing share of sites name them in robots.txt.
- AI bots made up an average of 4.2% of HTML requests to sites on Cloudflare's network in 2025, against 4.5% for Googlebot alone. Source: Cloudflare, Radar 2025 Year in Review.
- The AI bot share of HTML requests ranged from 2.4% in early April 2025 to 6.4% in late June. Source: Cloudflare, Radar 2025 Year in Review.
- Anthropic's crawl-to-refer ratio reached as high as 500,000:1 in 2025, the highest of the leading AI and search platforms. Source: Cloudflare, Radar 2025 Year in Review.
- OpenAI's crawl-to-refer ratio reached as much as 3,700:1 in March 2025. Source: Cloudflare, Radar 2025 Year in Review.
- Perplexity's crawl-to-refer ratio stayed below 200:1 from September 2025, while Google's ranged from about 3:1 to a peak of 30:1. Source: Cloudflare, Radar 2025 Year in Review.
- AI crawlers were the user agents most often fully disallowed in robots.txt files in Cloudflare's 2025 analysis, led by GPTBot, ClaudeBot and CCBot. Source: Cloudflare, Radar 2025 Year in Review.
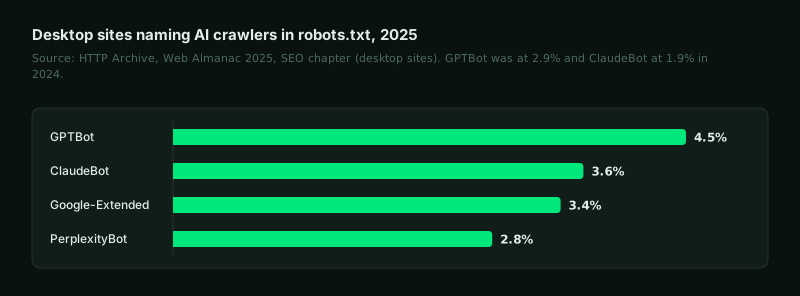
- GPTBot was named in the robots.txt of 4.5% of desktop sites in 2025, up from 2.9% in 2024, an increase of about 55%. Source: HTTP Archive, Web Almanac 2025: SEO chapter.
- ClaudeBot was named in 3.6% of desktop robots.txt files in 2025, nearly double the 1.9% of 2024. Source: HTTP Archive, Web Almanac 2025: SEO chapter.
- Google-Extended was named in 3.4% of desktop sites' robots.txt files and PerplexityBot in 2.8% in 2025. Source: HTTP Archive, Web Almanac 2025: SEO chapter.
- A valid llms.txt file was found on 2.13% of desktop sites in 2025, or 324,184 files across the mobile sites analysed. Source: HTTP Archive, Web Almanac 2025: SEO chapter.
- 39.6% of llms.txt files found by the Web Almanac were generated by the All in One SEO plugin and 3.6% by Yoast SEO. Source: HTTP Archive, Web Almanac 2025: SEO chapter.
- AI crawlers made up almost 80% of the AI bot traffic Fastly observed from mid-April to mid-July 2025, and Meta generated more than half of it. Source: Fastly, Q2 2025 Threat Insights Report (press release).
- North America received nearly 90% of the AI crawler activity Fastly observed in Q2 2025. Source: Fastly, Q2 2025 Threat Insights Report (press release).
- Automated traffic made up 51% of all web traffic in 2024, the first time in a decade that bots outnumbered humans, according to Imperva. Source: Imperva (Thales), 2025 Bad Bot Report highlights.
- Malicious bots accounted for 37% of all internet traffic in 2024, up from 32% the year before. Source: Imperva (Thales), 2025 Bad Bot Report highlights.
- AI bot activity on Akamai's platform surged by 300% over the year to November 2025, yet AI bots still made up only about 1% of all bot traffic there. Source: Akamai, Akamai Research: AI bots threaten foundation of web-based business models (November 2025).
- The commerce sector led AI bot activity on Akamai's platform, with more than 25 billion bot requests in a two-month observation period. Source: Akamai, Akamai Research: AI bots threaten foundation of web-based business models (November 2025).
hreflang and international setup in the wild
About one in five pages now carries hreflang markup, but implementation errors are common, most often a missing x-default.
- 20.3% of desktop pages and 19.7% of mobile pages included hreflang markup in the raw HTML in 2025. Source: HTTP Archive, Web Almanac 2025: SEO chapter.
- The share of pages carrying hreflang roughly doubled in a year, from about 9–10% in 2024 to around one in five in 2025. Source: HTTP Archive, Web Almanac 2025: SEO chapter.
- English (en) was the most used hreflang value, on 7.4% of desktop home pages, followed by x-default on 7.2%. Source: HTTP Archive, Web Almanac 2025: SEO chapter.
- French, German and Spanish were the next most common hreflang values, on 3.2%, 3.1% and 3.0% of mobile home pages respectively. Source: HTTP Archive, Web Almanac 2025: SEO chapter.
- On inner pages, every hreflang value other than en, x-default, fr, de and es appeared on less than 2.5% of pages. Source: HTTP Archive, Web Almanac 2025: SEO chapter.
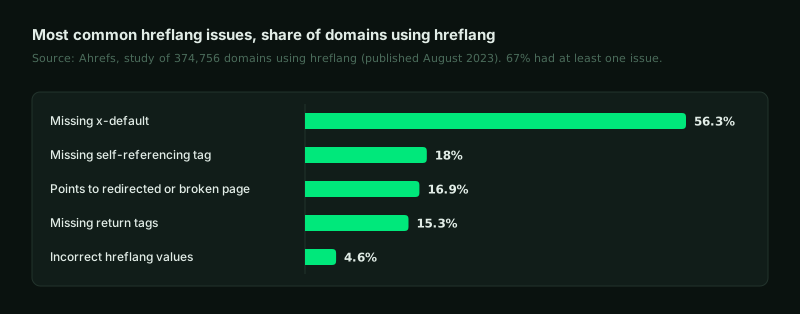
- 67% of 374,756 domains using hreflang had at least one hreflang issue, in Ahrefs' study. Source: Ahrefs, Over 67% of Domains Using Hreflang Have Issues (Study of 374,756 Domains).
- 56.3% of domains using hreflang had pages missing an x-default tag. Source: Ahrefs, Over 67% of Domains Using Hreflang Have Issues (Study of 374,756 Domains).
- 18% of domains using hreflang had pages missing self-referencing hreflang tags. Source: Ahrefs, Over 67% of Domains Using Hreflang Have Issues (Study of 374,756 Domains).
- 16.9% of domains using hreflang had tags pointing to redirected or broken pages. Source: Ahrefs, Over 67% of Domains Using Hreflang Have Issues (Study of 374,756 Domains).
- 15.3% of domains using hreflang had pages missing reciprocal (return) tags, which breaks the pairing between language versions. Source: Ahrefs, Over 67% of Domains Using Hreflang Have Issues (Study of 374,756 Domains).
- 4.6% of domains using hreflang had pages with incorrect hreflang values, such as invalid language or country codes. Source: Ahrefs, Over 67% of Domains Using Hreflang Have Issues (Study of 374,756 Domains).
Using these statistics
Each figure links to the page it came from. When you quote one, cite and link that original source; it is the authority, and it may have been updated since this page was checked. Every statistic also has its own anchor on this page (for example #s001) if you want to point at the list.
Numbers are copied exactly as each source prints them, and the year given is the year the data describes. Spotted a figure that has changed or is wrong? Email [email protected] and it will be corrected at the next refresh, due 26 January 2027.
Methodology
Selection. Stats come from the organisation that collected the data, on its own page: statistics offices (ITU, Eurostat), research institutes (Reuters Institute, Pew Research Center, Stanford HAI), platform and network operators (Google, Cloudflare, Fastly, Akamai, Imperva, StatCounter, Common Crawl, W3Techs, HTTP Archive) and companies publishing their own studies (Ahrefs, Semrush, Seer Interactive, SparkToro, CSA Research, IPC, Microsoft, Anthropic, Ipsos, GSMA, Slator). No stat roundups are cited. Four stats (the EU cross-border split) are Eurostat data as republished in the European E-commerce Report 2025 and are marked as secondary. The year given for each stat is the year the data describes, not the year it was published.
Checking. Every source page was fetched on 26 October 2026 and the number was searched for exactly as printed. Each sentence was then read against the text around the number to confirm the population, unit, country and year; six claims were reworded or re-anchored at this step. 23 stats could not be checked by the script: W3Techs serves an empty page to scripted requests, Ecommerce Europe, Slator and Akamai returned HTTP 403, and two sources are PDFs. These were read by hand, by opening the page or extracting the PDF text, and each carries a note in the data file saying how. For the Akamai release only quoted passages were seen, not the full text. The 21.6% Anthropic figure appears in the publisher's own chart caption.
Conflicts and caveats. StatCounter measures share of page views and Cloudflare measures share of search referrals, so their figures differ (for example, Yandex in Russia is 70.33% on StatCounter and 65% on Cloudflare); both are shown and labelled. In the Web Almanac 2025 SEO chapter, the prose and one figure disagree on the most common hreflang value and on the hreflang implementation method; the prose is cited and the method split is left out. The Microsoft AI Diffusion Report's ranking table has offset columns, so only figures stated in its text are used. Click-through data from Ahrefs, Seer Interactive, Semrush and SparkToro comes from each company's own keyword sets or clickstream panels; Pew's click data covers US adults only; Cloudflare, Fastly, Akamai and Imperva report traffic on their own networks. SparkToro's 2024 and 2026 zero-click figures use different data providers and are not directly comparable.
Older data. CSA Research's language-preference survey (2020), the Eurobarometer language survey (fieldwork 2023) and Ahrefs' hreflang study (2023) are older than two years. They are kept because no newer source measures the same thing, and their dates are shown. 87% of the stats describe 2024 or later.
Refresh. The page is re-verified quarterly, or sooner when a major source updates. Next refresh: 26 January 2027.
Sources
- W3Techs, Usage statistics of content languages for websites
- Common Crawl, Statistics of Common Crawl Monthly Archives: Distribution of Languages
- Wikimedia Meta-Wiki, List of Wikipedias
- ITU, Facts and Figures 2025: Internet use
- ITU press release, Facts and Figures 2025
- GSMA, The State of Mobile Internet Connectivity 2025 (press release)
- CSA Research, press release on Can't Read, Won't Buy – B2C (2020)
- CSA Research, Does Language Matter? The Impact of Language on the Customer Journey
- European Commission, Europeans' language skills (2024 survey on Europeans and their languages)
- European Commission, Europeans strive toward multilingualism (Eurobarometer news)
- Slator, 2026 Language Solutions & AI Market Report
- Eurostat, E-commerce statistics for individuals
- Ecommerce Europe & EuroCommerce, European E-commerce Report 2025 (light version)
- International Post Corporation, Cross-Border E-commerce Shopper Survey 2025
- StatCounter, Search engine market share worldwide
- StatCounter, Search engine market share in South Korea
- StatCounter, Search engine market share in the Czech Republic
- StatCounter, Search engine market share in the Russian Federation
- StatCounter, Search engine market share in China
- StatCounter, Search engine market share in Japan
- Cloudflare, Radar 2025 Year in Review
- Eurostat, 32.7% of EU people used generative AI tools in 2025
- Reuters Institute, Generative AI and News Report 2025
- Microsoft AI Economy Institute, Global AI Adoption in 2025 (AI Diffusion Report H2 2025)
- Anthropic Economic Index: the geography of AI use (September 2025)
- Stanford HAI, 2025 AI Index Report: Public Opinion
- Ipsos, The Ipsos AI Monitor 2025
- Google, AI Overviews are now available in over 200 countries and territories, and more than 40 languages (May 2025)
- Alphabet Q2 2025 earnings call: CEO's remarks
- Google, AI Mode is now available in more languages and locations around the world (October 2025)
- Alphabet Q2 2026 earnings call: CEO's remarks
- Reuters Institute, Digital News Report 2026: Emerging uses of AI chatbots for news
- Pew Research Center, Google users are less likely to click on links when an AI summary appears in the results (2025)
- Semrush, AI Overviews study (200,000 keywords)
- Ahrefs, Update: AI Overviews Reduce Clicks by 58% (February 2026)
- Seer Interactive, AIO impact on Google CTR: September 2025 update
- SparkToro, Zero-click searches: highest in the UK, lowest in Germany (2026, Similarweb data)
- SparkToro, 2024 Zero-Click Search Study (Datos clickstream data)
- HTTP Archive, Web Almanac 2025: SEO chapter
- Fastly, Q2 2025 Threat Insights Report (press release)
- Imperva (Thales), 2025 Bad Bot Report highlights
- Akamai, Akamai Research: AI bots threaten foundation of web-based business models (November 2025)
- Ahrefs, Over 67% of Domains Using Hreflang Have Issues (Study of 374,756 Domains)